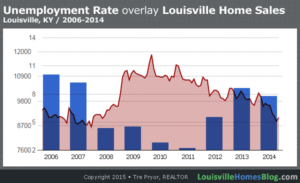
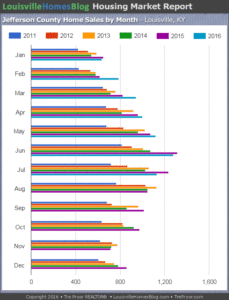
Today begins a new, regular posting of Louisville Home Sales compared to previous years. I find that putting data into pictures helps a great deal and I hope you find this new feature worthwhile!
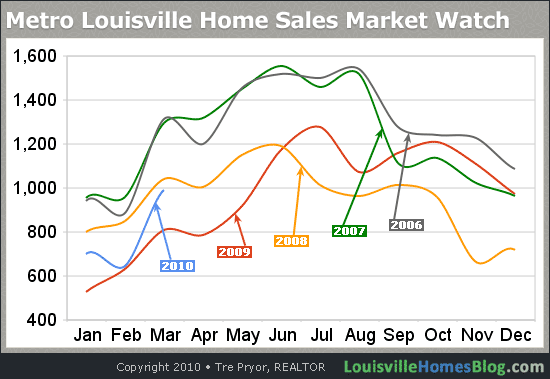
As you can see from the chart, 2008 and 2009 were well off the previous two years. Most notable (at least to me) was that the second half of ’09 was significantly better than the second half of ’08. Interesting.
Still too early to tell about where this year go, but if the activity of my cell phone is any indication, our April numbers should pass 1,000 sales.
Note: Part of an ongoing series highlighting the home sales in Metro Louisville Kentucky, the data is deemed accurate but not warranted. Publishing this chart is permissible per the Creative Commons license seen below. Contact us with any questions.