Interested parties… bookmark this page! It is the only place to find a Louisville KY home sales chart updated monthly! We’re looking at the total number of homes sold by the month. It’s important to look at the data this way to compare sales from the same month but in different years.
Louisville KY Home Sales Chart
This data for the Louisville KY home sales chart is only for homes sold in Jefferson County, which makes up the bulk of Louisville. Even though most think of Louisville, Kentucky as more than just Jefferson County, that is what this particular chart covers. If interested, I also publish Louisville KY Average Home Price each month.
As Louisville’s expert Realtor, I find it important to share information with my readers free of charge. All I ask is that you will consider letting me help you with your next real estate transaction.
There are many aspects to a real estate transaction, including the professional evaluation of a property’s value. You do not want to head down the road of purchasing a home only to find it was overpriced. Purchasing a Louisville home without representation is becoming an increasingly dangerous proposition, especially with the financing laws that went into effect in 2015.
Choose Louisville’s real estate expert to be your Realtor!
What It Covers
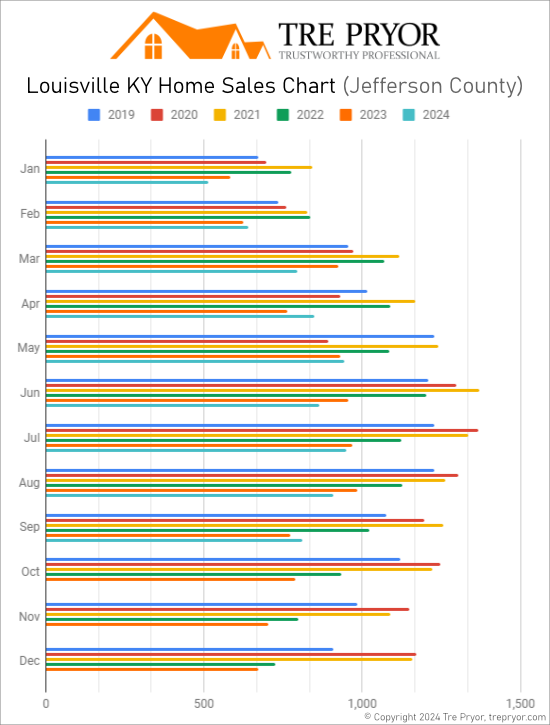
This Louisville KY home sales chart includes all the home sales for each specified month within the boundaries of Jefferson County, Kentucky. It’s also all homes, so we’re including condominiums, as well as, single-family residences, farms, and even auctions.
As you can see from the chart above, home sales in Louisville are at their highest point during the Summer months. This makes sense as children are out of school so it is a more convenient time for house hunting. After August, sales will decline toward the end of the calendar year. January is typically the slowest month for home sales while July is most often the busiest.
Note: It’s important to analyze Louisville home sales from similar months. For example, comparing June 2022 with June 2023 rather than comparing June with May, as seasonal factors have a great effect on home sales. Weather plays a large role in real estate sales.
Louisville Home Sales by Area
If you would like more specific information, mouse over the Sales/Prices by Area option at the top of the page and choose an MLS area. The chart above combines all of the MLS areas.
Other Housing Reports and Resources
Greater Louisville encompasses all of Jefferson County. Many think of Louisville as including the surrounding counties as well. These are:
- Bullitt County Homes Report to the South
- Spencer County Homes Report to the Southeast
- Shelby County Homes Report to the East
- Oldham County to the Northeast, which the multiple listing services (MLS) divide into North Oldham Homes Report and South Oldham Homes Report.
If you are interested in how our city is divided, I’ve also created the Louisville MLS Areas Map. On this map, the different MLS areas are outlined. From there you can also see current Active Listings by each MLS or with other criteria. Or, you can search All Louisville Homes For Sale as well.
Louisville Home Sales Data Comes from GLAR
The data used for this chart, and others on my site, comes from the Greater Louisville Association of Realtors (GLAR). While this date is believed to be accurate and reliable, it is not guaranteed.
Expert Guidance Leads to Superior Results
There are many ways to evaluate properties. It takes an experienced eye to identify the outliers and spot the trends. I’ve provided this basic overview for a couple of reasons. First, the larger the sample size the more reliable the results. Even though there are more than a million people in the city, only a small fraction of these people will buy or sell their Louisville in a given year. Second, having the data in chart form communicates the information more effectively.
More specific analysis is available to you if you’d like to contact me. I’m always looking for new clients so that I can help them achieve their Louisville real estate goals.