Welcome to our new and improved St. Matthews Homes Report! In this report, we cover the average home sales price and the number of homes sold in the St. Matthews neighborhood and surrounding areas. Previously, I used median sale price (which is better for math reasons) but switched to average sale price because that’s a value more people are familiar with.
This St. Matthews Homes Report covers all the homes located within St. Matthews and its surrounding areas as defined by the Louisville Association of Realtors (GLAR) as Louisville MLS Area 3 (see the map). I include the following Louisville neighborhoods and condo buildings:
- Beechwood Village
- Bellewood
- Broadfields
- Brownsboro Village
- Cherokee Gardens
- Clifton
- Crescent Hill
- Crestmoor
- Fairlawn
- Indian Hills
- Mockingbird Gardens
- Mockingbird Valley
- Norbourne Estates
- Parkside
- Plymouth Village
- Richlawn
- Riedlonn
- Rolling Fields
- St. Matthews
- Windy Hills
- Woodlawn Park
Other neighborhoods and subdivisions besides those listed are also included. Check out Best Louisville Neighborhoods for more information about the nicest neighborhoods in Louisville, KY.
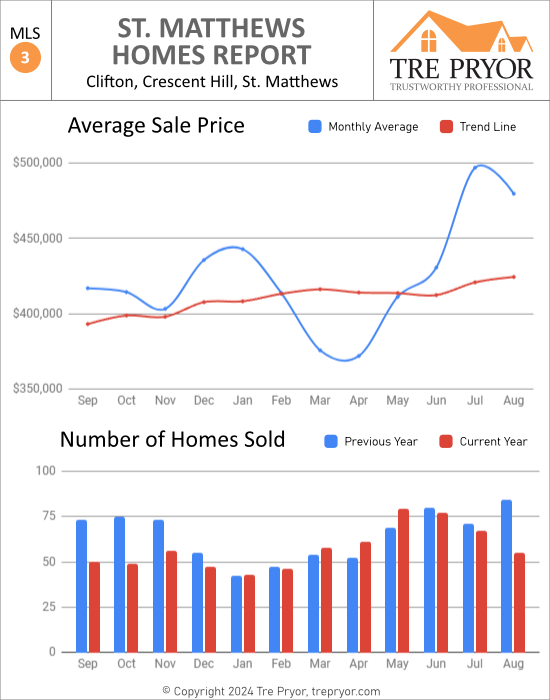
St. Matthews Homes Report
Now let’s look at the average home sales price and the number of homes sold in the St. Matthews neighborhood and surrounding areas within Louisville, Kentucky.
It’s important to note a few things.
- The sample size varies greatly by the MLS area. Area 0 is quite small and may only have a handful of properties sold in a given month. Area 7 is Louisville’s largest MLS area. Look at each chart’s scale to get a better feel for the area’s size.
- The 1-year trend-line gauges where home values are going. This is superior to simply looking at the monthly totals. We average the previous 12 months of the average sale prices to arrive at this value.
This St. Matthews Homes Report is just one of the many housing reports I publish here. Having access to this accurate, current information gives you control. This helps you make the best possible decision in your home-buying transaction. If you have any questions, please contact Tre Pryor as I would love to work with you on achieving your real estate goals.
Would you like to use one of our graphics? There are two conditions. First, do not modify the graphic. Second, cite Tre Pryor as the author by providing a link back to this website.
We also have Average Home Price in Louisville KY and the Louisville Home Sales Chart updated monthly.
St. Matthews Kentucky Summary
St. Matthews is a vibrant and bustling suburb located east of downtown Louisville, Kentucky. Situated within Jefferson County, St. Matthews is known for its diverse mix of residential neighborhoods, commercial districts, and recreational amenities. The neighborhood covers a compact area and is bordered by major roadways, including Interstate 264 (Watterson Expressway), providing convenient access to downtown Louisville and surrounding areas. St. Matthews has a population of approximately 18,000 residents, creating a lively and dynamic community within the Louisville metropolitan area.
One of the most noteworthy aspects of St. Matthews is its thriving commercial district along Shelbyville Road and Westport Road. The neighborhood is home to the Mall St. Matthews and Oxmoor Center, two prominent shopping destinations featuring a wide range of retail stores, restaurants, and entertainment options. St. Matthews also offers a variety of parks and recreational facilities, including Seneca Park and Brown Park, providing residents with opportunities for outdoor activities and community events. The neighborhood’s central location, vibrant atmosphere, and strong sense of community make St. Matthews a popular and desirable place to live, work, and play in the Louisville region.