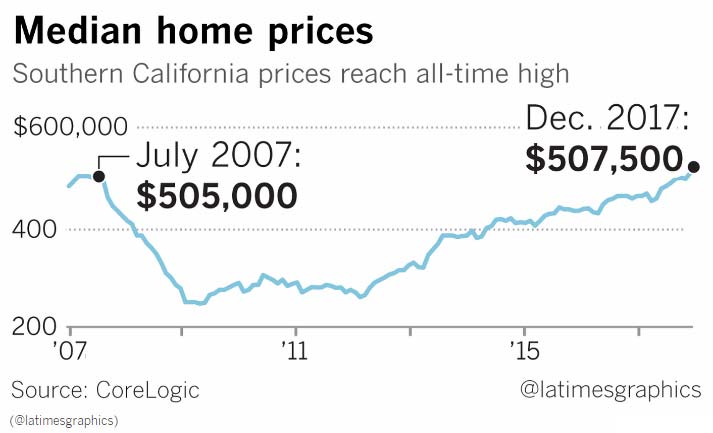
A friend of mine shared this story about how California home prices are hitting their highest point recently. As I was reading, I thought, “Yeah, so have we here in Louisville.” Immediately, my next thought was, “I wonder how Louisville Home Values match up?”

Well… that’s the easy part.
First, I grabbed the chart from the California story.

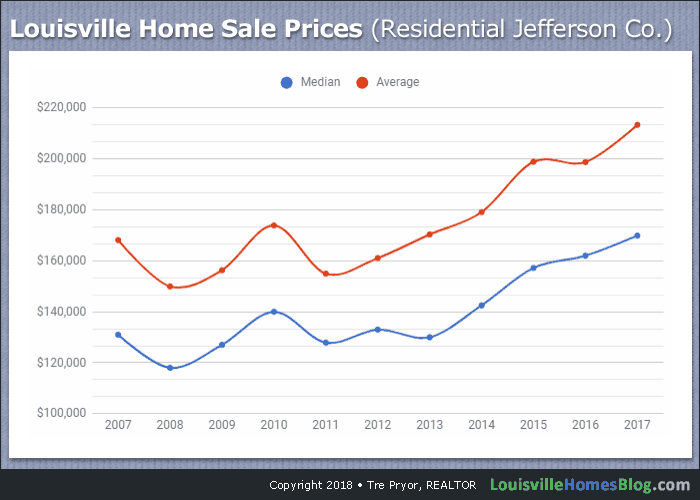
Louisville Home Values: 2007-2017
Then, I went to collect all the same data for Louisville, Kentucky. Going a step further, I wanted to see both Average Home Sale Prices, as well as, Median Home Prices. Why not, right?
I used the month of December for each year from 2007 through 2017. Nice round number and here’s what I discovered.

Our numbers are far more modest compared to California, right? I can’t imagine paying half a million dollars for such a basic property. We have it much better here in Louisville.
Let’s analyze this chart. While Louisville home prices did drop in 2008-2009, they bounced back and gained all of that back by 2010. A second, unexpected drop occurred in 2011. It wasn’t until 2014 that things really took off.
In California, it took 10 years to barely recover the values lost during the housing recession. Here in Louisville, we went from a median home sale price of $131,000 in 2007 all the way up to $169,900 a decade later. Wow! That’s a 29.7% increase!
When looking at Averages rather than Median sale prices, the numbers are still quite amazing. Going from $168,138 to $213,340 gives us a return of +26.9%. Most of this has occurred during the 4 years following 2013.
Going Forward
I’m not sure our market is done yet either. With housing inventory at all time lows, prices will continue to rise.
Are you looking for some stellar investment returns? Look no further than Louisville real estate. Seriously.


