So, you want to know how fast are homes selling in my area? Well, if you live here in Louisville, KY I can tell you. Otherwise, you’ll have to continue searching my friend.

Even better, I will give you more! I won’t just give you an easy-to-find, city-wide metric. Nor will I use generalized terms like “blazingly fast” but instead, I’ll give you the up-to-the-minute raw data. Yeah, I’m pretty much a data nerd. 😉
But since I’m a nice nerd, I’ll give you this information first, for free. Secondly, I’ll also give it to you in picture form and then also the raw data. I aim to please.
So let’s go!
How Fast Are Homes Selling in My Area
Here’s that chart I promised. Each circle represents a Louisville ZIP code. The larger the circle, the larger the geographic area of that ZIP. Nifty, eh?
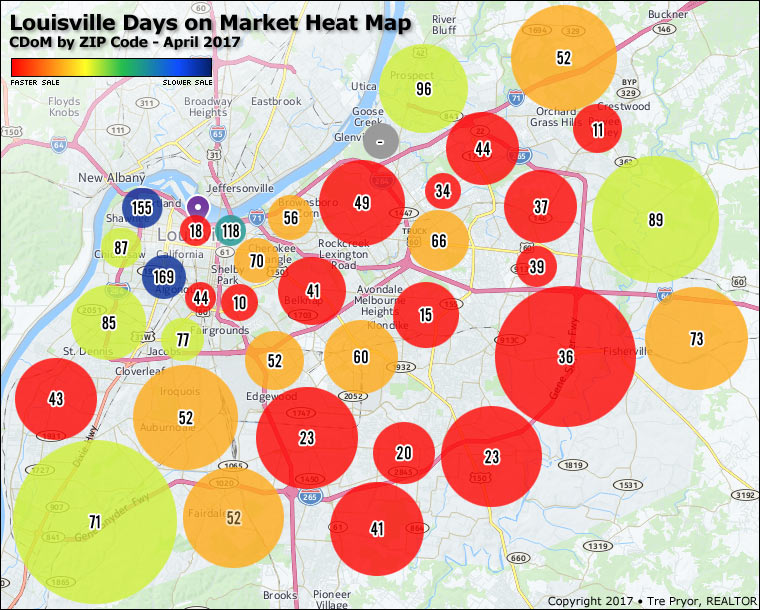
As you can tell from the heatmap, there are only a few ZIP codes in all of Louisville where home sales are slow. But there are a lot where homes are flying off the shelves!
For example, check out 40217. This area is located east of the University of Louisville, inside the Watterson Expressway, and south of Germantown. These inexpensive homes, when available, are selling on average in just 10 days. That’s ridiculous really. Can you say, “hot market”?
How about 40056? This highly sought-after area is called Pewee Valley. It’s just across the line in Oldham County. Homes aren’t nearly as affordable but that isn’t stopping buyers. This ZIP averages just 11 days in April 2017.
If you have a home in these hot areas, now is the time to sell.
Louisville Days on Market by ZIP Code
Now for all you number crunchers, here’s the raw data. I also kept last April’s value in there for comparison. Most areas sped up but a few slowed a bit.
| ZIP Code | April 2017 | April 2016 |
| 40014 | 52 | 112 |
| 40023 | 73 | 51 |
| 40025 | 0 | 0 |
| 40056 | 11 | 47 |
| 40059 | 96 | 126 |
| 40118 | 52 | 63 |
| 40202 | 118 | 94 |
| 40203 | 18 | 39 |
| 40204 | 70 | 39 |
| 40205 | 41 | 60 |
| 40206 | 56 | 107 |
| 40207 | 49 | 71 |
| 40208 | 44 | 136 |
| 40210 | 169 | 209 |
| 40211 | 87 | 108 |
| 40212 | 155 | 101 |
| 40213 | 52 | 81 |
| 40214 | 52 | 103 |
| 40215 | 77 | 68 |
| 40216 | 85 | 102 |
| 40217 | 10 | 64 |
| 40218 | 60 | 63 |
| 40219 | 23 | 61 |
| 40220 | 15 | 63 |
| 40222 | 66 | 96 |
| 40223 | 37 | 95 |
| 40228 | 20 | 47 |
| 40229 | 41 | 47 |
| 40241 | 44 | 58 |
| 40242 | 34 | 40 |
| 40243 | 39 | 26 |
| 40245 | 89 | 117 |
| 40258 | 43 | 52 |
| 40272 | 71 | 79 |
| 40291 | 23 | 96 |
| 40299 | 36 | 71 |
So there you have it. Our Louisville real estate market is piping hot!
If you want more specific info regarding “How Fast Are Homes Selling in My Area” for example, your neighborhood, please contact me and I’ll get that for you. I’m always happy to help!