Welcome to the #1 source for Louisville Real Estate Reports. I’ve recently revamped all the real estate reports for Louisville, Kentucky. You won’t find anything like them on any other website and they are completely free! As Louisville’s real estate expert, I’ve been creating these reports for you since 2006.
You can also look at two special real estate reports that cover the entire city of Louisville, Kentucky.
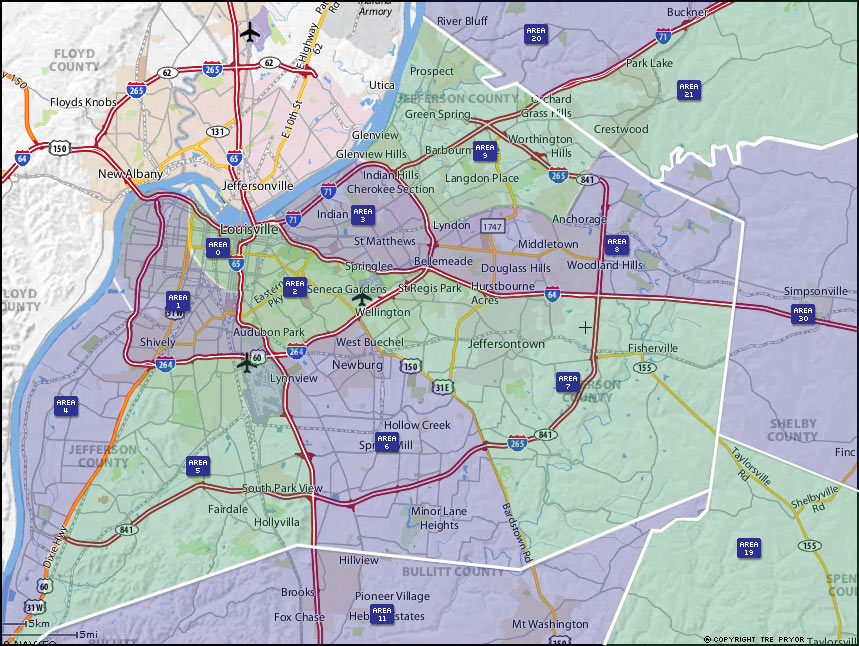
But let’s focus on smaller geographic areas for these Louisville real estate reports. I’m going to highlight two metrics for smaller groupings defined as MLS areas. They contain both the average sale price and the number of homes sold presented in chart form to make it easier to visualize the information. Now you get a more specific idea of how real estate is performing in each of these 15 MLS areas.
Did I mention they’re completely free?! That way you can make better home buying and selling decisions here in Louisville. If you’d like even more specific data or analysis about your neighborhood please contact me and I’ll create a custom report just for you.
Louisville Real Estate Reports
Here are the reports that you can access on TrePryor.com.
- Area 0: Central Downtown District/Old Louisville
- Area 1: Downtown/Old Lou./Shively/West Lou./Butchertown
- Area 2: Butchertown/Highlands/Germantown
- Area 3: Clifton/Crescent Hill/St. Matthews
- Area 4: Pleasure Ridge/Valley Station/Shively
- Area 5: Auburndale/Fairdale/Iroquois Park/Shively
- Area 6: Buechel/Highview/Okolona/Fern Creek
- Area 7: Jeffersontown/Fern Creek/Hikes Point
- Area 8: Middletown/Hurstbourne/Douglass Hills/Anchorage
- Area 9: Prospect/Anchorage/Glenview/Lyndon
- Area 11: Bullitt County
- Area 19: Spencer County
- Area 20: Oldham County N-I71
- Area 21: Oldham County S-I71
- Area 30: Shelby County
If you would like to use any of these graphics on your website, you will need permission. But as long as you provide a link back to the associated page, I’m happy to let you do just that.