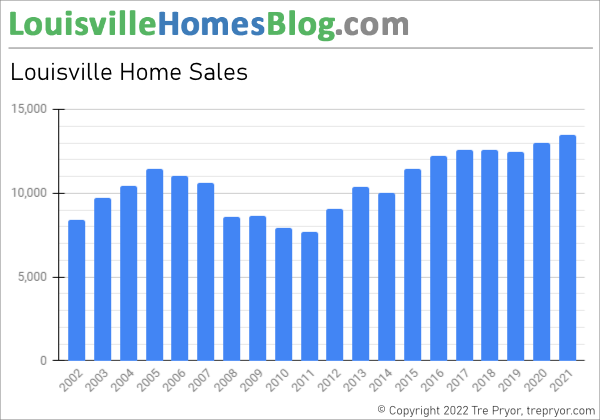
Read more about the article Monthly Comparison: Louisville Home Sales Chart through October 2013
Each month of 2013, we've seen more Louisville home sales than the previous year.

Monthly Comparison: Louisville Home Sales Chart through October 2013

Would you talk about consistency? We're 10-for-10 in 2013. Each month this year, we've seen increased home sales here in Louisville. Now, October didn't destroy the previous year like September…

Continue ReadingMonthly Comparison: Louisville Home Sales Chart through October 2013
Read more about the article Monthly Comparison: Louisville Home Sales Chart through September 2013
Wow! To the moon goes Louisville home sales in this easy to read chart.

Monthly Comparison: Louisville Home Sales Chart through September 2013

There were 1,015 homes sold in Louisville during September. That's huge! Last September, we only saw 782 sales. We're talking about a 29.8% increase over the previous year for Louisville…

Continue ReadingMonthly Comparison: Louisville Home Sales Chart through September 2013
Read more about the article Louisville Home Sales Chart through June 2013, Monthly Comparison
June was a good, but not great month for Louisville real estate as we came up 10 sales short of May, when traditionally June has more activity.

Louisville Home Sales Chart through June 2013, Monthly Comparison

Not the best month for home sales but as home values move higher, Louisville homes for sale will be affected. And right now, inventory is lower than it has been…

Continue ReadingLouisville Home Sales Chart through June 2013, Monthly Comparison
Read more about the article Monthly Comparison: Louisville Home Sales Chart through May 2013
Yet another strong month for Louisville real estate activity with 985 homes sold during May 2013.

Monthly Comparison: Louisville Home Sales Chart through May 2013

And the train keeps rolling on! With 985 homes sold during the month of May, Louisville just realized a 14.7% improvement over the same month one year ago. That's big!…

Continue ReadingMonthly Comparison: Louisville Home Sales Chart through May 2013
Read more about the article Monthly Comparison: Louisville Home Sales Chart through December 2012
Another month's tally, another strong performance for 2012. Can 2013 keep up the positive trend?

Monthly Comparison: Louisville Home Sales Chart through December 2012

Note: This Louisville real estate market report covers the monthly home sales for the past six years in Jefferson County (Louisville, KY) and is published monthly. It can also be…

Continue ReadingMonthly Comparison: Louisville Home Sales Chart through December 2012
Read more about the article Monthly Comparison: Louisville Home Sales Chart through November 2012
Another month's tally, another strong performance for 2012. Can 2013 keep up the positive trend?

Monthly Comparison: Louisville Home Sales Chart through November 2012

Note: This Louisville real estate market report covers the monthly home sales for the past six years in Jefferson County (Louisville, KY) and is published monthly. It can also be…

Continue ReadingMonthly Comparison: Louisville Home Sales Chart through November 2012
Read more about the article Monthly Comparison: Louisville Home Sales Chart through October 2012
Those teal blue lines are really starting to impress! Another strong month for home sales in Jefferson County, easily beating the previous two years but falling short of the 2009 total.

Monthly Comparison: Louisville Home Sales Chart through October 2012

In Jefferson County, there were 793 homes were sold in October. This represents a 24.3% increase over the previous year when just 638 homes were sold for the month. Only…

Continue ReadingMonthly Comparison: Louisville Home Sales Chart through October 2012
Read more about the article Louisville Home Sales chart through August: 6 Year Comparison
The Louisville home sales chart above covers the previous 6 years and takes into consideration homes sold throughout Jefferson County but not the surrounding counties of Oldham, Shelby, Spencer or Bullitt.

Louisville Home Sales chart through August: 6 Year Comparison

We were moving along, making steady progress: 859 in May... 859 in June... 851 in July... then *bam* 1,016 homes sold in August! Check out this Louisville home sales chart.…

Continue ReadingLouisville Home Sales chart through August: 6 Year Comparison
Read more about the article Chart: Louisville Home Sales through July: 6 Year Comparison
The Louisville home sales chart above covers the previous 6 years and takes into consideration homes sold throughout Jefferson County but not the surrounding counties of Oldham, Shelby, Spencer or Bullitt.

Chart: Louisville Home Sales through July: 6 Year Comparison

Almost three in a row! In May, 859 homes were sold in Jefferson County, Louisville. June? 859! How about July? 851. So close! So once again we're met with a…

Continue ReadingChart: Louisville Home Sales through July: 6 Year Comparison