To begin, it’s important to say there are a myriad of ways to crunch any group of numbers. For our real estate example, is Louisville only Jefferson County? Or do we include the surrounding counties? Are we supposed to remove cities like Jeffersontown or Prospect that reside in Metro Louisville?
Things can get very complex, very quickly. Then there is methodology.
Are we comparing averages of homes sold? Taking the median value or using a formula that helps reduce variance caused by sample size or another factor?
We could only look at single-family homes, or we might include condos and patio homes. Don’t forget about multi-family properties!
Shew. I get tired just thinking about it.
Each choice we make paints a different picture when the final tallies are computed.
Kiplinger Must Be Using Fuzzy Math
With that in mind, my brother sent me this Kiplinger piece, 12 Cities Where Home Prices Have Fallen Most. I was not surprised that their findings were different. But I was shocked that they ranked Louisville #1!
With no mention of their methodology, they cite Clear Capital as the source and claim Louisville’s one-year change in home prices was -10.7%.
Never fear! As your Insider for Louisville real estate, I’ll share my methods and show you why things are not nearly as bad as they are reported.
Let’s start small and work our way up.
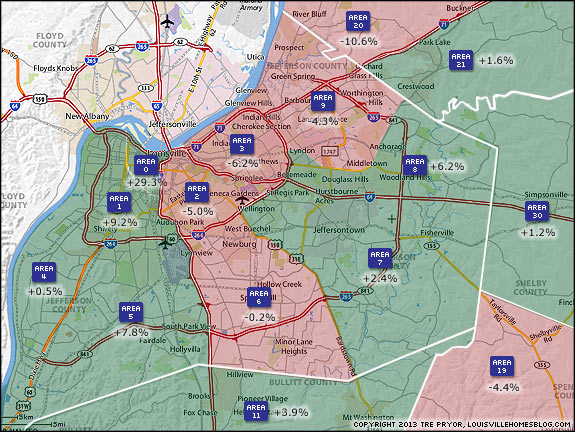
Changes in Louisville Home Prices by Area for 2012
Like last year, I’ve created a map of Louisville’s MLS areas and the one-year change from December 2011 to December 2012.
Rather than rely on simply a single month’s sampling of homes sold, I took the average of the previous 12 months of sales and compared those.
As you can see, there’s more green than red compared to last year’s map.
To give you some real numbers, our biggest loser was Area 20 (Oldham County, north of I71) where we were looking at $265,732 for December 2011 and just $237,485 for this past December, for a -10.6% decrease.
Our strongest performing area for the year was Area 0 (Central Downtown, Old Louisville, Butchertown) where the change from $115,652 to $149,557 netted a 29.3% increase!
Louisville Home Values Mostly Improving
So where did Kiplinger get their -10.7% number? Maybe if we aggregate this data, a larger number of homes in the red areas influence the overall… nope. The 1-year trailing average for Louisville home prices in December 2011 was $130,282. This year it’s $136,108, for a 4.47% improvement!
Maybe they included all the surrounding counties?
That doesn’t change things much, as the newly sold home price is now +4.77% since last December.
There you have it. I’m sure Kiplinger was able to juggle the numbers somehow but the truth of the matter is Louisville home prices didn’t drop over 2012, in fact, it’s quite the opposite, they rose.
[Note: Each home is a unique entity. The true value of a property is what someone will currently pay you for it. If you want to know what the most likely value might be, contact a professional Realtor to perform a Competitive Market Analysis (CMA) which should contain comps, or comparable sold homes, and a manually-adjusted formula to compute the most accurate value.]