It’s that time of year again! Each year near the beginning of September I write a piece, that I think of as the “Best Bang for Your Buck” article. Beginning in 2014, this piece ran on Insider Louisville. The following year I published a new one. Today is the day I release the most current version. It can’t be found anywhere else. So, let’s jump right in and find out where you can find the best real estate deals in Louisville Kentucky.
This article will outline not only the parts of Louisville where home prices are lower but consider changes from one year to the next. Obviously, the higher-priced parts of the city are also nicer—more amenities, better location, etc. But now you’ll have the power of information at your fingertips. Many of our city’s real estate agents don’t have this knowledge but you will!
How Real Estate Deals Are Found
First, a bit of methodology. I’ve been using the same geographic areas to make sure we’re comparing apples to apples. If you have specific questions, by all means, contact me. But it should be fairly straightforward.
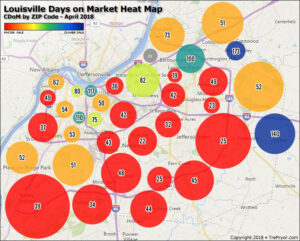
Taking all the single-family residences (no condos) that have sold during the past 12 months, we chart the data. Then, I plot it on the helpful map you see below.
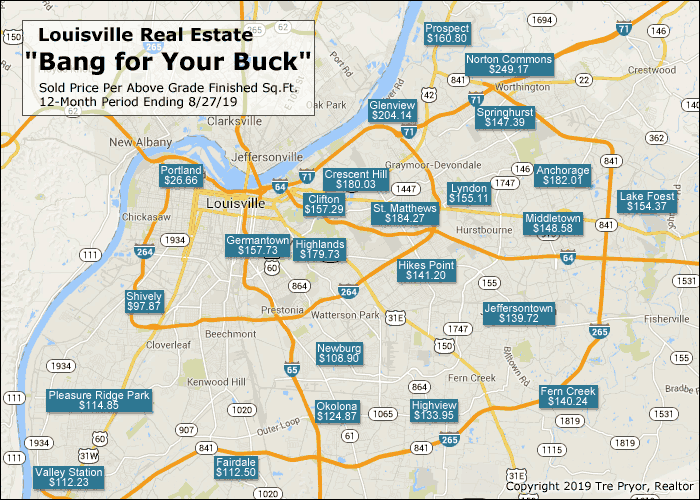
For those that like their data raw, here are the values for the best real estate deals in Louisville Kentucky.
Sold Price Per Square Foot by Area
Taking all the sold properties, then averaging their sold price per square foot we find the least and most expensive real estate in Louisville, Kentucky.
| 2018 | 2019 | Change | |
| Anchorage | $197.20 | $182.01 | -7.70% |
| Clifton | $147.67 | $157.29 | 6.51% |
| Crescent Hill | $180.11 | $180.03 | -0.04% |
| Fairdale | $103.29 | $112.50 | 8.92% |
| Fern Creek | $135.14 | $140.24 | 3.78% |
| Germantown | $144.63 | $157.73 | 9.06% |
| Glenview | $188.17 | $204.14 | 8.48% |
| Highlands | $176.11 | $179.73 | 2.06% |
| Highview | $123.99 | $133.95 | 8.03% |
| Hikes Point | $136.81 | $141.20 | 3.21% |
| Jeffersontown | $132.92 | $139.72 | 5.11% |
| Lake Forest | $150.14 | $154.37 | 2.82% |
| Lyndon | $142.42 | $155.11 | 8.91% |
| Middletown | $141.05 | $148.58 | 5.34% |
| Newburg | $85.98 | $108.90 | 26.66% |
| Norton Commons | $244.94 | $249.17 | 1.73% |
| Okolona | $105.19 | $124.87 | 18.71% |
| Pleasure Ridge Park | $108.00 | $114.85 | 6.34% |
| Portland | $29.55 | $26.66 | -9.80% |
| Prospect | $158.06 | $160.80 | 1.73% |
| Shively | $88.51 | $97.87 | 10.58% |
| Springhurst | $145.05 | $147.39 | 1.61% |
| St. Matthews | $183.52 | $184.27 | 0.41% |
| Valley Station | $104.54 | $112.23 | 7.36% |
| Average: | $139.71 | $146.40 | 5.41% |
Keep in mind that only homes that sold in the past year are included in this data. Data points can vary quite a bit. Smaller areas, like Anchorage and Springhurst, have far fewer homes exchanging hands so their value is a bit more suspect. While larger areas like Jeffersontown and Highview, where more than 500 homes were sold show more solid, reliable values.
Louisville Real Estate That’s Dropping
Some things should jump out at you immediately. For instance, given that city-wide saw a 5.41% increase in sold price per square foot, why did any parts of the city see a decline?
Let’s look at these three areas.
Portland has been a unique proposition for decades. Despite many attempts at revitalization, we haven’t seen much success. Portland remains Louisville’s most affordable housing. Depending on your goals, this might make it an attractive target. Those prices are crazy low! Before jumping in feet first, make sure to do your due diligence and learn why this is the case and what the future might hold.
Next up is Anchorage—the quaint county home to some of Louisville’s rich and famous. How could their values drop? Part of the equation is what I mentioned earlier about the sample size. There were only 24 homes that sold in the past 12 months within the city of Anchorage.
The other part is likely a simple market correction. Here were Anchorage’s values over the years.
- 2014: $170.67
- 2015: $172.23
- 2016: $187.56
- 2017: $197.54
- 2018: $197.20
- 2019: $182.01
The growth in 2017 and 2018 was likely due to some higher-priced properties bringing the overall average up for the city. Yet, if this value declines again in 2020 that will be even more surprising and something to keep an eye on.
Lastly, Crescent Hill saw a very minor drop this year. Given that this value was $138.36 in 2014, I think residents are appreciative of their property’s recent appreciation. (See what I did there?)
Other Findings
As one who’s lived in Louisville my whole life, I understand how different people love different things. I’ve had clients who could only live in Old Louisville. The charming Victorian homes just spoke to them. Other clients demand newer, open-concept layouts in their homes. Different strokes for different folks.
When I look at this year’s results, here are some observations that stick out for me.
- Given that Lake Forest has the reputation of being only for the “rich” the $154.37 number is actually quite affordable. Can you believe Lyndon and Germantown are actually higher? A large part is due to the overall size of the home.
- Newburg and Okolona (even Shively to a lesser extent) saw the largest increase in values from one year to the next. This underscores the current reality that most of today’s home buyers are targeting the lower end of the market. These are the properties that are seeing the biggest gains.
- Even though Norton Commons only saw a 1.7% increase in the past year, it remains Louisville’s most expensive real estate. And it’s not even close. Only Glenview is now over the $200/sqft threshold.
- Location, location, location! We really do put a premium on a central location, right? How else could you explain the numbers we see in St. Matthews and Crescent Hill? Because living here means you are close to everything!
Well, I hope you have enjoyed reading Best Real Estate Deals in Louisville Kentucky. Please share it with your friends! If you have any questions, I’m always happy to help.