March Home Price Index for Louisville, Jefferson County
Reports from CoreLogic come out each and every month. I don't always publish the results because it's quite dry and without regular context, it's often hard to decipher. The other…
Posts about Real Estate Trends or Real Estate Statistics
Reports from CoreLogic come out each and every month. I don't always publish the results because it's quite dry and without regular context, it's often hard to decipher. The other…
Home prices are near the bottom, mortgage rates are historically low, number of distressed properties is on the decline, all signs that the housing recession is ending. National experts are…
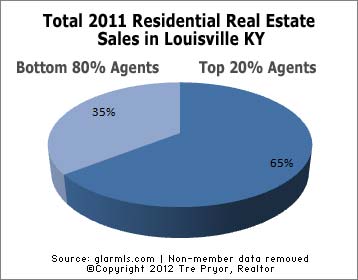
I was very interested in the results when I began writing “So how much do Louisville real estate agents make?” last year.
Great infographic from Active Rain, the largest real estate social network. There's no real local tie in this piece to Louisville but it's interesting to note the interest in rental…
Updated: 2/3/2012. Thanks to Chris Cox who found a calculation error.
Many held high hopes for an improving real estate market heading into 2011. Well, maybe that’s an exaggeration but there were some signs that the housing recession was lessening and perhaps we would all see improvement in 2011. In most locations, that didn’t occur. But it did in some!
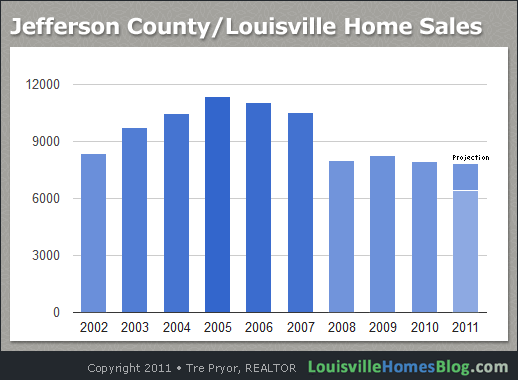
2011 was a busy year. In fact, despite the market being down again here in Louisville (see this handy dandy chart that compares Jefferson County monthly home sales back the previous 6 years) I actually had my best year yet. Yeah me!

This isn’t great news but every little bit helps. Analysts who monitor real estate data are saying that home values should stop dropping late next year.
The health of any real estate market is measured by steady increases in home values along with activity levels that trend upward along with population growth. The same is true for Louisville real estate. Going back 10 years gives us a more historical viewpoint on where we were and where we are now.
Studies are done all the time. They can be frivolous, somewhat worthwhile, or ground-breaking. On a scale of 1-to-10, I'll give this one a 6.5. If the question is, "What…
Mark Twain popularized this famous quote, “There are three kinds of lies: lies, damned lies, and statistics.” By their very nature, numbers can be manipulated to show many results, even opposing ones, and still be factually accurate.

I’m sure you’ve heard the phrase, “Perception is reality”. Take the value of brands, for example. People’s perception of Tylenol as a safe, pain-reducing medicine prior to 1982 was sky-high. It was the world’s top seller, for crying out loud. Then reports surfaced that a woman died from cyanide poisoning from taking Tylenol.
(more…)
May has disappointed me greatly. I had far greater plans in mind only to see them dashed on the rocks.
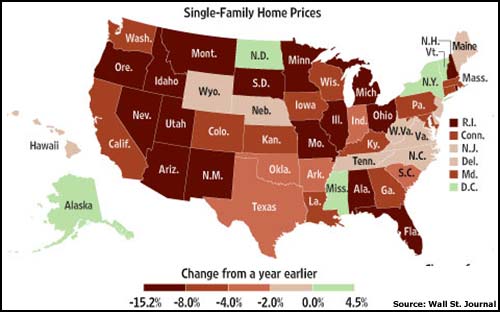
The Wall St. Journal doesn’t focus on our local market but the points they make for the country as a whole can be applied to our situation.
Another month of waiting is behind us. What have we learned? Not much… we’re still waiting.
We all have heard that the housing market is “down.” It’s taking longer for people to sell their homes and some just won’t sell at all. (This is primarily true in the higher price ranges.) While this is tremendous news for Louisville home buyers, sellers continue to have a difficult time.