I’ve been writing a “Best Bang for Your Buck” article since 2014. (If you’re interested, I’ll link them at the bottom of this piece.) Somehow I missed writing last year’s article. Something must have interrupted my thinking *cough* *Covid* *cough*. Well, I’m not going to let that disrupt me again! So without further ado, here’s the most current data you can find on Louisville real estate prices by area.
Let’s go!
Louisville Real Estate Prices by Area
So a bit of the explanation first. What we’re doing is comparing the sold price per square foot for single-family homes, not condos, to arrive at our metric. But these numbers alone don’t paint the whole picture.
It’s logical to think that areas with higher prices are better areas, that is mostly true but not always. These data points should be just one part of your property analysis as you search for your dream home in Louisville, Kentucky.
My Methodology
Here’s how I arrived at these numbers. We’re evaluating the same geographic areas each time. Only homes that have sold in the past 12 months make it into our calculations. Then we chart the results in this helpful map.
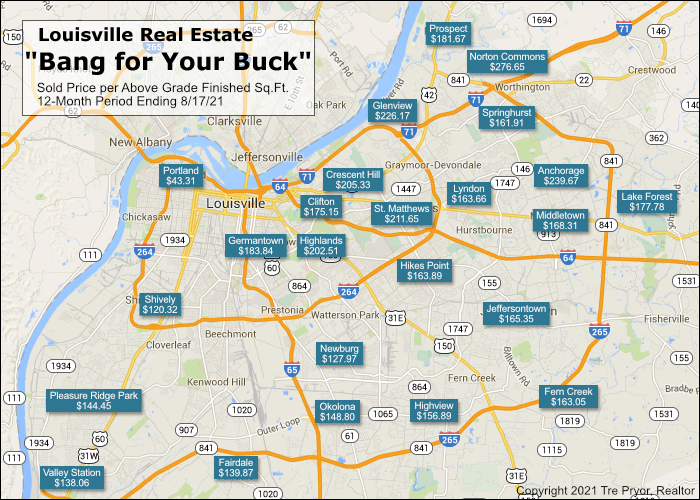
Sold Price Per Square Foot by Area
This time I’ve sorted the areas by which ones experienced the largest change. As you can see, even though Portland was cheap real estate before and still is now, when compared to other parts of Louisville, it experienced the largest increase.
| 2019 | 2021 | Change | |
| Portland | $26.66 | $43.31 | 62.49% |
| Highlands | $179.73 | $226.17 | 25.84% |
| Pleasure Ridge Park | $114.85 | $144.45 | 25.77% |
| Fairdale | $112.50 | $139.87 | 24.33% |
| Middletown | $148.58 | $183.84 | 23.73% |
| Valley Station | $112.23 | $138.06 | 23.01% |
| Shively | $97.87 | $120.32 | 22.93% |
| Okolona | $124.87 | $148.80 | 19.17% |
| Jeffersontown | $139.72 | $165.35 | 18.35% |
| Newburg | $108.90 | $127.97 | 17.50% |
| Glenview | $204.14 | $239.67 | 17.41% |
| Highview | $133.95 | $156.89 | 17.12% |
| Fern Creek | $140.24 | $163.05 | 16.26% |
| Hikes Point | $141.20 | $163.89 | 16.07% |
| St. Matthews | $184.27 | $211.65 | 14.86% |
| Lake Forest | $154.37 | $175.15 | 13.46% |
| Prospect | $160.80 | $181.67 | 12.98% |
| Anchorage | $182.01 | $205.33 | 12.81% |
| Germantown | $157.73 | $177.78 | 12.71% |
| Crescent Hill | $180.03 | $202.51 | 12.48% |
| Springhurst | $147.39 | $163.66 | 11.04% |
| Norton Commons | $249.17 | $276.65 | 11.03% |
| Lyndon | $155.11 | $168.31 | 8.51% |
| Clifton | $157.29 | $161.91 | 2.94% |
| Average: | $146.40 | $170.26 | 18.45% |
Check out that change for the Highlands! Sometimes demand is just so strong that it will always push the limits whether the product you’re buying warrants it or not.
Low End Rising
One trend we Realtors have understood for the past couple of years is that the greatest demand for buyers is in the low end of the market. This makes sense as more people can afford to buy a less expensive home than some can afford a mansion.
So areas like PRP, Fairdale, Okolona, and Shively with their lower home prices all experienced tremendous price growth. But if you notice that Newburg, also a low price point, didn’t see the same growth. You should mark this as a red flag.
It’s also interesting to note that when you look at Louisville real estate prices by area, both Clifton and Lyndon, moderately priced areas, received the smallest increases in our report. Still a bargain?
Other Findings
When I look at this year’s results, here are some things that popped out.
- When you see that the city as a whole increased by 18.45% in just two years, that’s a big deal. It’s especially dramatic since Louisville typically experiences just a 4% annual appreciation. These past couple of years are not typical.
- It still appears that Lake Forest continues to be a tremendous value for its location and level of finish. $175.15 is a very good number for what you get in return. Of course, Prospect ($181.67) is higher but Middletown ($183.84) is as well.
- Norton Commons continues to be the most expensive real estate in the city… and by a large margin. But their appreciation of the last two years is just 11.03% is more than 7% less than the city average of 18.45%.
- St. Matthews has a tremendous reputation, a central location, and tons of amenities. But if you move just a few minutes south to Hikes Point you can save 47.76/sqft on average.
I hope you enjoyed reading the 2021 version of Louisville Real Estate Prices by Area. If you have more specific questions or would like to see if I am available to be your Realtor, please contact me. I’m always happy to help!
Previous Bang for Your Buck Articles
- 2019: Best Real Estate Deals in Louisville Kentucky
- 2018: Best Places to Buy a House in Louisville Kentucky
- 2017: Best Bang for Your Buck in Louisville Real Estate 2017
- 2015: Best Bang for Your Buck in Louisville Real Estate 2015
- 2014 & 2016 articles were published on Insider Louisville which is no longer in business.